

Executive Summary
Wild Dog Coffee Company is a single-location, independently owned cafe that is preparing to open another branch. In order to facilitate this growth, a demand management strategy was elaborated on the current venue to enhance the operational decision-making before scaling. The analysis combines the forces of demand forecasting, inventory management, and labor planning to deliver quality services at low costs and to maintain operations. A high level of statistical relationship was determined between advertising spending and the use of espresso beans, using six months of historical data to yield a result indicating that promotional spending accounts for approximately 95% of the observed demand elements.
According to the forecasting model, the advertising budget of Month 7, which consists of $1,350, is expected to use approximately 1,253 pounds of espresso beans. This would be equal to a daily requirement of 41 pounds or about 441 espresso drinks a day, which is more than the throughput capacity of a single service line, and this would imply the requirement of extra staffing at peak hours. Two inventory management methods, periodical review and continuous review, were tested with a limitation of bean perishability, restricted storage area, and sensitivity of cash flow. Under such circumstances, it is suggested to have a continuous review system, where a weekly replenishment order is of about 300 pounds, and the safety stock is of about 10 pounds. The staffing analysis also suggests that three and part-time employees would minimize the use of overtime and increase service quality. The plan will end with an implementation roadmap and risk factors that will see the stabilization of the current operations and aid in expansion in a period of eight weeks.
1. Introduction and Context
Wild Dog Coffee Company has a wide variety of espresso based coffee drinks with breakfast and lunch items, and it has a large, stable, and diverse clientele. With the business ready to launch a second store, the reinforcement of demand management habits at the present store is a necessity to ensure the service quality, cost management, and customer satisfaction. Growth in the absence of an effective operational infrastructure exposes the organization to the threats of stock-outs, operational inefficiencies, and service failures.
This demand management plan is based on the principles of operations management and quantitative analysis to make decisions based on the data. The given analysis is aimed at four main goals: investigating the correlation between advertising spending and product demand; creating a reliable forecasting model that can be used to predict the use of espresso beans; reviewing inventory systems that do not contribute to the wastage of resources but do not result in stocking out; and staffing schedules to balance the expenses on staff and the performance of service. All these factors constitute a scalable evidence-based framework reinforcing the existing operation and ensures the successful opening of the second Wild Dog Coffee franchise.
2. Business Data and Assumptions
The working schedule of Wild Dog Coffee Company is 6:00 a.m. to 8:00 p.m. every day, which means that it will serve 14 hours a day, and two more hours will be spent on the opening and closing. Each order of beverage production needs two employees, one barista and one order taker, and one service line has the capacity to produce about 30 espresso drinks in an hour. Being an espresso-based beverage, each beverage needs approximately 0.094 pounds of espresso beans that are bought in the form of 25-pound bags. The Espresso beans are shipped and charged at an average price of $9 per pound, seven days after receiving an order. Orders over 250 are shipped free, and the holding costs are approximately 10% per unit per year. Because of quality concerns, the time of maximum freshness of roasted beans is limited to 14 days. The store has a 364-day operation.
Historical Demand Data:
Month | Advertising ($) | Beans Used (lbs) |
1 | 1,050 | 987 |
Month | Advertising ($) | Beans Used (lbs) |
2 | 1,500 | 1,412 |
3 | 1,000 | 1,020 |
4 | 1,250 | 1,140 |
5 | 1,500 | 1,322 |
6 | 1,500 | 1,399 |
Past record of the last six months indicates that the company has been spending between $1,000 and $1500 every month on advertising, with annual consumption of 987 to 1412 pounds of the espresso beans, respectively. The creation of forecasts of demand and inventory, and staffing decisions made in the analysis of the demand management is based on this dataset.
3. Forecasting Analysis
Forecasting is a key component of operations management because it allows organizations to predict future demand and make appropriate decisions on the inventory, staffing, and production. In the case of Wild Dog Coffee Company, the overall forecasting task at hand is to determine the future consumption of espresso beans in relation to the advertising expenditure, as it depends on the management’s view that advertising spending has a direct effect on the volume of sales. To measure this relationship, a simple linear regression model was used to provide a prediction at Month 7. This projection was then converted to daily beverage volume and staffing implications in order to facilitate operational planning.
Forecasting may be referred to as the organized projection of the future demand utilizing past information and discernible patterns (Goodwin et al., 2023). In Wild Dog Coffee Company, forecasting helps to serve two purposes: ensuring a reasonable inventory stock and preventing the unwarranted stock that would translate into wastage or an unwarranted holding cost. Proper demand forecasts enable the business to fulfill customer expectations at any time while keeping the scarce financial and storage resources safe.
Relevance
Demand forecasting helps Wild Dog Coffee Company in making operational decisions in advance in terms of purchasing inventory and staffing. The wisdom of the advertising spending and consumption of espresso beans can help the management to align marketing strategies and the level of capacities in the operations. This synchronisation decreases the chances of service bottlenecks, stockouts or high labor costs during peak demand times.
Technically, the forecasting model offers a quantitative premise of inventory replenishment and staffing variation. With the assistance of advertising budgets that are associated with the projected consumption of beans, the managers can arrive at the right order quantities and the right timing of the employees to meet the projected demand. As an example, a predetermined increase in the advertising budget in the course of the promotional processes can be assessed beforehand, and the business could have enough inventory and manpower. The correlation of advertising with demand also goes in favor of the planning of labor since the signs indicate when the greater volumes of orders might need more workforce to preserve the quality of the services. The combination of marketing decisions and operational planning allows for facilitating the workflow and minimising interruptions, and facilitating a uniform customer experience during periods of peak demand.
3.1 Impact of Advertising on Product Demand
Regression outcome shows that advertising expenditures significantly affect product demand. The slope coefficient of 0.7885 is indicative of the fact that an increase in the amount of money given to advertising by one dollar increases the sales of the espresso beans by about 0.79 pounds per month, or 841 extra beverages for every $100 of increase in advertising expenditure. This observation proves the fact that advertising is an active stimulus of the sales volume and not only accompanies the changes in demand. The coefficient of determination (R2= 0.951) also shows that advertisement explains 95.1 per cent variance in the monthly consumption of espresso beans. The intercept of 188.22 pounds signifies a constant level of demand, which can be attributed to the repeat customers, walk-in traffic, and word-of-mouth referrals.
Hypothesis:
When advertising expenditure is increased, demand for espresso drinks will increase, which will lead to increased consumption of espresso beans.
Model:
The equation to estimate the relation between monthly advertising expenditure (x) and consumption of the espresso beans monthly (y) is done using a simple linear regression model. The overall shape of the model is as follows:

Step 1: Compute Means
Advertising expenditures (x̄) and espresso bean usage (𝑦̄) are obtained by averaging over six months of historical data.

Step 2: Compute Slope (β1)
The slope coefficient is obtained by the standard least-squares formula of regression:

Interpretation: The estimated slope (0.7885 1) states that every extra dollar spent on advertising produces close to 0.79 pounds of extra demand of the espresso beans monthly. This operationally implies that a $100 increment in advertising expenditure translates to an increase in the quantity of the number of pounds of beans sold to about 79 pounds, which translates to the sale of about 841 more beverages in a month. This finding validates the fact that marketing costs directly and quantifiably affect the volume of sales, which enables the management to translate advertisement budgets into tangible business needs.
Step 3: Compute Intercept (β0)
Regression estimation involves the calculation of the intercept value:
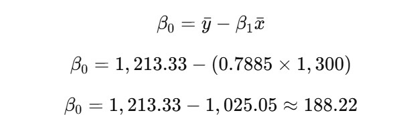
Interpretation: The intercept (β₀ = 188.22) is the amount of beans that is expected to be consumed when there is no advertising expenditure. This minimum level is the sales that are caused by customer loyalty, foot traffic and casual promotion. Although advertising does boost the demand significantly, this base gives a picture that Wild Dog Coffee Company has a stable base of core customers that can sustain functioning even in the event that no advertising is paid.
Step 4: Final Regression Equation
The regression model fitted is as follows:

Step 5: Coefficient of Determination

Interpretation: The value of R2 is 0.951, which implies that advertising spending explains 95.1% of the difference in consumption of espresso beans per month. Such a high level of explanatory power is an indication that the model has both a high level of statistical strength and operational utility. The management is assured of using this regression model to make predictions about demand, stocking levels, staffing levels, and promotional activities to ensure that the activities are made to meet the anticipated sales trends to aid in effective and well informed decision making.
Practical Interpretation:
- Incremental advertising effect: A one-month increase in advertising spending by 100 will bring about an approximate increase in sales of the espresso bean by around 78.85 pounds in a month.
- Drink level translation:5 ounces (0.09375 pounds) of beans are needed to make each espresso:

According to this conversion, an extra $100 spent on advertisement will result in about 841 more espresso drinks in a month. This proves the fact that investment in advertising is not in vain, not only in statistical terms, but also in terms of operation planning.
Two important regression outcomes are important to managers:
- Slope coefficient (0.7885): A one-unit increase in advertising dollars corresponds to a monthly increase in the sales of pounds of espresso beans sold to the tune of 0.79. This would mean almost 79 more pounds or approximately 840 drinks for every one hundred dollars more on advertising.
- Intercept value (188 pounds): Wild Dog Coffee Company would still anticipate making approximately 188 pounds of espresso beans per month despite the absence of advertising spending, considering the high foot traffic, customer loyalty, and referrals.
Collectively, these findings indicate that advertising is an overwhelming force of demand, which explains about 95% of the change in espresso bean use per month. Advertising, therefore, acts as an effective working lever, which could be employed to direct both the inventory planning and the workforce schedule decisions.
3.2 Month-7 Forecast

Using a planned advertising budget of $1,350 in Month 7:
Interpretation: The regression model estimates the monthly consumption of an espresso bean to be around 1,253 pounds with a $1,350 marketing budget. This projection will mean an average of 41 pounds of beans daily, which translates to approximately 441 espresso drinks per day. The demand is more than what the operations can handle, considering that the capacity of just one beverage service line is about 420 drinks per day. Consequently, this will require some adjustments like running a second service line during peak times or more staffing, to ensure that there will not be overcrowding, and hence customer satisfaction will not be lost.
Confidence Intervals:
According to regression estimates and standard errors of the regression:
- 95% confidence interval (mean demand): The average demand will be between [1,198-1,307] pounds, which is where the average amount of beans that will be used per month is expected to fall when the advertising level is at $1,350.
- 95% prediction interval (individual month): [ 1,112, 1,393] pounds, which is a more uncertain interval than the others since it includes the variability of the monthly amount of the value.
Interpretation: These confidence intervals offer operational planning boundaries that are feasible. The confidence interval also shows that the average monthly demand is expected to lie between 1,198 and 1,307 pounds; the broader prediction range shows the possibility of the usage being up to 1,393 pounds within a single month. Operations management-wise, this variability is what necessitates the safety stock and flexible staffing arrangements, which will take into consideration the potential increase in demand without affecting the service reliability or availability of the products.
3.3 Daily Demand Conversion
In order to operationally forecast on a monthly basis, the demand will be transformed into daily averages. By the assumption of a standard operating month:

Daily bean usage:

Daily beverage output:
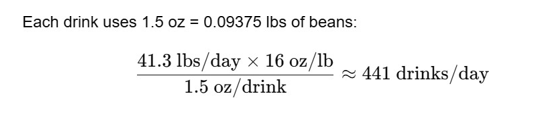
Capacity Check:
One beverage line produces:

Forecasted demand = 441 drinks/day → exceeds single-line capacity by 21 drinks/day.
Operational implication: The demand is projected to be higher than the single line capacity by approximately 21 drinks per day. To ensure that service times will still be acceptable and that there will be no excessively long queues, Wild Dog Coffee Company will need to have the second beverage line working during the peak hours, which will be approximately two hours a day.
This conversion to demand on a daily basis confirms that the volumes of sales forecasted will be greater than the service capacity at present. As a result, staffing and equipment will have to be changed in order to match operational resources to the expected demand. Failure to do so may lead to increased waiting time, poor customer service, and loss of business during prime time.
Inventory Management Analysis
Inventory management is a vital operational activity for Wild Dog Coffee Company because it has a direct effect on the freshness of the products, service integrity, and cost maintenance. Espresso beans contain a narrow range of optimal freshness of about two weeks, and therefore, overstocking is not viable, and at the same time, overstocking increases the risk linked with understocking as well. Consequently, inventory choices have to balance between effectiveness and responsiveness.
Quantitative inventory management methods offer an organized method of establishing the reorder point, safety stock, and replacement policy. In order to determine the best system to use in Wild Dog Coffee Company, two inventory control methods are considered, which include the continuous review (Q, R) system and the periodic review (P, S) system.
This aspect is especially hard in terms of inventory management since roasted espresso beans do not stand the test of time. Oversupply leads to a higher probability of waste, and low inventory may lead to the disruption of beverage production and the temporary shutting of the cafe. The goal is hence to implement an inventory system that will provide continuous service, keep the beans fresh, and reduce unnecessary carrying costs. The use of quantitative models will enable the management to come up with an optimal policy that fits these operational constraints.
4.1 Inputs
Based on the demand forecast and the data regarding operations, the following parameters are set:
- Average daily demand: 41.3 lbs/day
- Standard deviation of daily demand: 84 lbs/day
- Lead time (L): 7 days (time from placing an order to receiving beans)
- Service level target: 98%, corresponding to a z-score of 05 from the standard normal distribution.
- Package size: Beans arrive in 25-lb
- Cost per pound: $9.00.
- Holding cost rate: 10% per year of unit
Interpretation: The mean daily demand is 41.3 pounds, and the relatively small deviation indicates that Wild Dog Coffee Company has constant yet not negligible changes in usage. With a seven-day lead time, the company will have to plan for the uncertainty of the demand within the seven days to prevent stockouts. Using the service level of 98% gives the safety stock requirement of some 10 pounds. This buffer is less than 1% of the monthly demand, and it is adequate to hedge against most of the demand variations without generating an excessive inventory that may undermine freshness.
4.2 Safety Stock Calculation
Safety stock absorbs the demand variability risk between the supplier lead time and increases the chances of reducing stockouts. The conventional formula of safety stock is used:
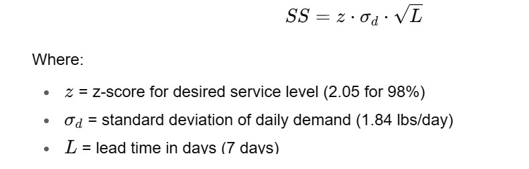
Step-by-step calculation:

Interpretation: Wild Dog Coffee Company ought to have about 10 pounds of safety stock to ensure a service level of 98%. This amount is approximately 0.8% of the average monthly demand and offers sufficient cushioning against unpredictable, sharp increases in demand. This small buffer will enable the company to be customer responsive without having too much stock to store and incurring too many holding expenses.
4.3 Reorder Point
The reorder point (R) is the mark where a replenishment order will be issued to avoid a stockout that can occur during the lead time. The reorder point is computed with the expected demand in the case of lead time and safety stock.

Step-by-step calculation:
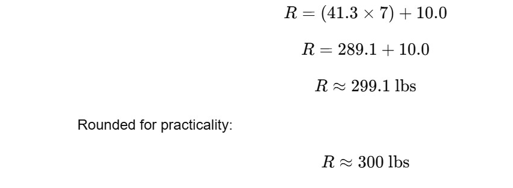
Interpretation: The reorder point has been calculated to be about 300 pounds; this means that once the total inventory reaches this point, a new order should be made. This threshold will ensure that Wild Dog Coffee Company is not forced to interrupt its services to the customers during the seven days of the lead time, even when the demand surpasses the average, considering that the expected demand is about 289 pounds per week. This amounts to approximately 12 bags of espresso beans in stock operationally. Orders placed after this time will pose a high risk of stockouts, and through this, operations will be impacted, and customer satisfaction will be adversely affected.
The inventory management is a key factor in aiding the efficient operations of Wild Dog Coffee Company. The reorder decisions made based on the forecasted demand would allow the company to keep optimal levels of inventory that would avoid shortages and overstocking. This is made possible by continuous monitoring to maintain the freshness of the beans and also allows continuous production of its beverage, especially in the peak demand times.
How the Continuous Review System Works Operationally?
With the continuous review system, the inventory is measured on a real-time basis, and a replenishment order is placed once the inventory has reached the predetermined reorder point. In the case of Wild Dog Coffee Company, this is achieved with the stock remaining at 300 pounds. That is when an order of the predetermined quantity (Q) of 300 pounds is made. By doing this, the inventory level will be kept to a manageable level that will eliminate the chances of a stockout and result in low holding levels.
Benefits for Wild Dog Coffee
Avoiding Stockouts
The continuous review system allows the company to maintain adequate inventory to satisfy customers during the entire lead time by causing replenishment at the reorder point. This is especially useful when the demand is high due to the advertising campaigns, because inventory can be replenished on the spot instead of waiting until a review is scheduled.
Cost Efficiency
Regular small orders will reduce the scale of on-hand inventories that are necessary, cutting down the holding cost and reducing the risk of waste through spoilage. Placing orders of 300 pounds simultaneously would enable Wild Dog Coffee Company to maintain the cash flow and make good use of the minimal storage area without loss of product freshness.
Enhanced Customer Satisfaction
To ensure customer satisfaction, it is a requirement that there is consistency in the supply of products. The constant check system promotes the incessant service delivery of the business, where the supply of espresso beans allows customers to make an order and receive it instantly without having to wait or miss sales because of a short supply.
4.4 Continuous Review System (Q, R).
A continuous review system, also known as a fixed-order-quantity system, refers to a situation where the level of inventory is continuously checked, and a set amount of order quantity (Q) is placed once the inventory level has reached the reorder point (R).
Weekly demand ≈ 289 lbs.
Given beans are shipped in 25-lb bags, the nearest feasible order quantity is:

Average on-hand inventory:

Annual holding cost per pound:

Annual holding cost total:
Annual holding cost=160×0.90=$144
Pros:
- Low service levels and few stockout risks.
- Automatable and predictable ordering process.
- Less safety stock than a periodical check.
Cons:
- Inventory should be continually monitored.
- More frequent ordering when the demand is very high.
Interpretation: The continuous review approach is more responsive to Wild Dog Coffee Company in comparison with the inventory systems. The company will reduce waste, and the average inventory level will be low, as the supplier packages will be 300 pounds, which is the same order quantity assigned by the company. The holding cost is low, and real-time monitoring will make sure of replenishment in good time, a significant aspect considering the two-week period of freshness of espresso beans.
4.5 Periodic Review System (P, S)
Periodic review system periodically reviews inventory and orders to replenish inventory to a desired amount (S). Supposing a weekly review rate (P = 7 days):
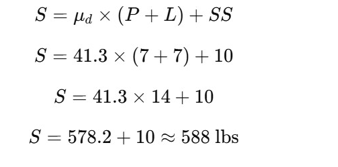
Average order quantity:

Pros:
- Simpler to administer.
- Does not need so much monitoring.
Cons:
- Increased safety stock levels.
- Higher chances of having stockouts between reviews.
- Increased chances of stocking out and lower freshness.
Why Choose Continuous Review Over Periodic Review
Although the periodic review system is administratively simple, it poses a significant risk to Wild Dog Coffee Company. The high demand between the review periods may wipe out the inventory before the next order is placed and thus cause stockouts. Higher safety stock levels would then have to be made to offset this by raising holding costs and spoilage risks. These risks are more than the advantages of scaled-back monitoring, considering that the company has limited space in terms of storage, cash flows, and quality expectations. Conversely, a continuous review system offers real-time responsiveness to demand variations, optimum safety stock, and stable services.
4.6 Recommendation
Selected Inventory Management System.
Considering that Wild Dog Coffee Company has such low storage capacity and limited cash flow, and since the freshness of roasted espresso beans is also stipulated, the Continuous Review (Q, R) inventory system is the most suitable. This inventory management system would always maintain stock levels and needs to be replenished immediately when the stock hits a specific reorder level, which would help reduce constrictions.
Recommended Parameters
The proposed parameters are:
Order Quantity (Q): 300 lbs (12 bags)
Reorder Point (R): 300 lbs
Safety Stock (SS): 10 lbs
Review Frequency: Continuous monitoring with weekly ordering
Rationale for Selection
The suggested order quantity is based on the packaging of the supplier and removes inefficiencies that may arise because of unfulfilled orders. The weekly deliveries help keep the beans within their optimum time of freshness. The holding costs are on the low side since it is estimated to spend about 144 annually, and a service level of 98% makes sure that the product is available when needed. The continuity of monitoring is also combined with point of sale systems, which allow real-time tracking of inventory and fast decisions. Altogether, it is possible to note that this inventory policy strikes a balance between freshness, cost management, and the reliability of the services and offers a scalable model that can be implemented in the future when opening a second Wild Dog Coffee store.
5. Scheduling and Staffing Analysis
5.1 Labor Needs
In order to sustain effective service at Wild Dog Coffee, there should be an accurate calculation of labor requirements to suit customer demand. As per the operational model, a barista and a non-barista are required: one to make drinks and another to take customer orders and other front-of-house duties. The minimum staffing needed in the two positions amounts to around 98 hours each week. The extra staff of approximately 14 hours per week will be required during peak times so that waiting times will not be excessive. The non-barista position also includes opening and closing duties, and they have an additional 14 hours per week.
This results in total weekly labor needs of:

These requirements form the foundation for evaluating alternative staffing scenarios.
5.2 Scenario A – Limited Overtime with One New Part-Time Non-Barista
Scenario A will provide a solution to staffing breaks by involving the hiring of one part-time non-barista and using overtime to cover the hours. The strategy would minimize the recruitment of various people but would put additional pressure on the current employees. The weekly labor cost in this scenario is estimated to be $3,215 with overtime premiums and a $500 hiring cost, which is incurred once. Overtime hours in the two jobs are about 38 a week.
Although this alternative reduces the recruitment costs, it has operational risks. Overtime may lead to fatigue, a decrease in productivity, and staff turnover when practiced over a long period (Altemus, 2024). Long hours can also cause poor service delivery and burnout on the part of employees working in a customer-oriented setting, such as a coffee shop.
5.3 Scenario B – No Overtime with Three New Part-Time Hires
In scenario B, the removal of overtime is done by recruiting three more part-time workers to address peak times. This system offers more well-balanced coverage of shifts and does not overwork employees. Scenario B has a weekly cost of labor of $3,137, whereas Scenario A has an average cost of labor of 3,137.2, though the number of employees is higher in Scenario A. Onboarding of three new hires also increases the initial hiring cost to $1,500. The cost is, however, compensated for by the lack of overtime remuneration and better employee output.
The first weakness of Scenario B is the service stability. The number of employees is spread evenly, which allows for maintaining coverage during periods of high demand and minimizing the probability of burnout. The mood of the staff is enhanced because employees will work able hours, hence the retention and performance are enhanced (Zhenjing et al., 2022).
5.4 Recommendation
Scenario B is the most appropriate staffing plan to be used by Wild Dog Coffee in terms of cost, service quality, and sustainability. Even though the initial employment expense is increased, the removal of extra time enhances service uniformity and removes staff burnout. This would facilitate the long-term stability of operations, and this is in line with the growth strategy of Wild Dog Coffee. The labor resources are also optimized to bring customer satisfaction and growth in the future through the staffing structure. Nonetheless, the effective improvement in staffing should be coupled with an efficient inventory system to facilitate consistent operations.
6. Inventory Management and Staffing Plan Recommendation
6.1 Inventory Management System
Wild Dog Coffee is recommended to adopt a Just-in-Time (JIT) inventory method combined with a Point-of-Sale (POS) tracking system. Through this approach, the inventory orders on beans, milk, and bakery products are matched with real-time sales data. The POS system facilitates forecasting of popular items within the demand for drinks and seasonal products, which cuts down on wastage and curtails stockouts during peak hours. This enhances cost management and the sustainability of freshness that is essential in ensuring the quality of products.
6.2 Staffing Plan
Based on the analysis in Section 5, the staffing plan that has been recommended is Scenario B, where three new part-time employees will be employed, and no overtime. Such a system will give a stable coverage, eliminate burnout, and promote quality customer service. Both the base and peak hours should be staffed, and barista and non-barista positions should cross-train each other to be able to adjust to the demand changes.
6.3 Integration of Inventory and Staffing
The synergistic solution matches operational planning and demand. The POS data not only covers the inventory, but also identifies the peak time, which is useful in making staffing decisions. JIT inventory and balanced staffing used together lower the cost, enhance the reliability of the services, and offer scalability to meet future growth.
7. Recommendations
Having examined forecasting, inventory, and staffing, it is possible to suggest three recommendations to Wild Dog Coffee. These measures are to enhance the management of demand, operational efficiency, and scalability, and they are based on quantitative analysis.
7.1 Maintain and Re-Fit the Regression Model Monthly
The regression model that is used in forecasting must be preserved and updated every month. The model shows that advertising expenditure has a high correlation with the demand for beans, which accounts to about 95.1% deviation in the demand. The strong R2 confirms that advertising is a good predictor of inventory and marketing planning.
The monthly refitting of the model will make sure that it remains accurate due to the shifting consumer preferences, seasonal trends, and changes in competition. This sensitivity to demand can be changed by promotions, events, or competing activity, and hence periodic recalibration will avoid model drift. The advertising expenditure and usage of the beans (real usage) should be gathered monthly in the form of marketing records and the POS system. The analysis of these inputs can be done through Excel, R, or Python to update the regression parameters. Other predictions made must be checked with the actual sales to determine any residual errors, and better forecasting is made (Kalcheva et al., 2025). Wild Dog Coffee Company will maintain a dynamic forecasting system by integrating this process into the standard processes. The method is cost-effective; staff training is minimal, and the connection of marketing decisions with supply chain planning is strengthened considerably.
7.2 Implement the Continuous Review (Q, R) Policy
The second suggestion is to switch to a Continuous Review (Q, R) inventory system with application of the developed parameters:
Order Quantity (Q): 300 lbs (12 bags)
Reorder Point (R): 300 lbs
Safety Stock (SS): 10 lbs
This system constantly follows up on inventory and activates reenactment when inventory hits the reorder point. Continuous Review is better than Periodic Review due to the short freshness of roasted beans, since the first one requires less safety stock, and it responds to changes in demand quicker than the second one. Supplier packaging is matched with the order quantity, which favors weekly delivery with a balance between holding cost and freshness. The reorder point is 7 days’ lead time, which will have the stock replenished before it is depleted.
The 10 lbs safety stock has a service level of 98, which ensures that stock is not overstocked due to demand surges. It should also be integrated into the POS system, where the reorder point will send an automatic alarm to the new orders (Hondl, 2025). The approach reduces wastage, ensures the availability of products, and can be expanded to other sites. According to Haddon and Bousquette (2025), such a strategy allows companies like Starbucks to have a smooth correlation between procurement and storage space and customer demand. Through this implementation of the Continuous Review system, Wild Dog Coffee will ensure constant product availability, minimize wastage, and maintain the quality of services that consumers have come to expect without growing its operational costs beyond manageable levels. It can also be easily scaled to the second location, as the same set of parameters can be applied at first and then modified according to the specific demand pattern of the second location.
7.3 Adopt Scenario B Staffing for No Overtime and Better Service
The third recommendation is to adopt the Staffing Scenario B so as to eliminate overtime and enhance capacity of services. In spite of the fact that Scenario B had the same amount of hours per week (238) as Scenario A, the labor was more effectively distributed to satisfy the maximum and to avoid overworking of individual employees. This practice eradicates the overtime, which prevents the fatigue of workers and leads to a decrease in fluctuating payroll and industry best practices in sustainable workloads. Scenario A, the compensation of overtime hours raised the labor cost per week and posed the risk of decreasing long shifts productivity. On the other hand, Scenario B had the best staffing even on the busy times with a balance made between the staffings in shifts and the hours. This would cost 2978 per week, which is less by 237 a week compared to the 3215 dollars per week in Scenario A, so the saving of direct labor of 12000 dollars a year, and it does not reduce services.
Operationally, Scenario B will as well ensure that all the drink order fulfillments will be completed by two employees, one of which will be the one who will be taking orders. Meanwhile, the other one makes drinks, thus maintaining the service standard of the company. The division of shifts according to the forecasted demand patterns (daily and weekly rush) will prevent the bottlenecks during rush hours and idle labor during less busy times: this will eliminate the possibility of overtime outcomes in terms of fewer burnouts and fewer turnover risks in terms of employee relations. Workers are more likely to give their best when they are at normal working time as per the working hours. In addition, the low cost of labor frees up part of the budget, which can be redirected to either employee training, cross-training, or special sales promotion to receive more sales.
In order to utilize Scenario B, the management may begin by evaluating the previous transaction records on a daily and hourly basis in order to optimize the start and the end time of the shift during a peak period. The schedule of work should be planned in an alternative way, taking into consideration the aspects of fairness and needs of the operation to create nice and equally distributed shifts to the eligible workers. With the introduction of an integrated scheduling program, the generation of shifts, the monitoring of labor costs, and automated notifications will be generated with the help of which off-the-book management can be reduced to a minimum. Finally, the key performance indicators such as the average wait times, customer satisfaction rates, and sales per labor hour should be monitored periodically to make sure that the newly developed schedule will be able to deliver the quality of services and operational efficiency.
7.4 Integrated Benefit of the Recommendations
The three recommendations depend on each other. The regression models are re-fitted after every month and this will ensure that the demand forecasts are not wrong, and so the Continuous Review inventory system is instructed. Effective prediction will mean that the inventory policy will start the re- ordered goods on time, thereby preventing out-of-stock and overstocking. Meanwhile, the Scenario B staffing will ensure that the deployed human resources will correspond to the demand trends, which implies that the company will be in a position to successfully meet the projected sales volume. The consequence is a closed loop, automated demand management process: the marketing drives the demand, realistically forecasted demand, inventory, and staff are set to support the demand, and the operational performance information is returned into the forecasting model to optimize it. Such converged model will work in the favour of the company when it institutes two operating locations as it will offer a trial operating template that could be developed and replicated.
8. Risk & Sensitivity Analysis
Effective demand is proactive risk management and sensitivity control to help with resilience in operations. Every 10 percent increase in any demand due to a seasonal demand, successful advertising, or competitor issues will require an increase in reorder point (R) to only sustain service. This change is to guarantee that the greater sales velocity can be representative of the rate of inventory replenishment during high activity. In case of supplier’s lateness, the reorder level should be increased by the daily demand multiplied by the latency days. This buffer ensures that there is no interruption with the supply chain and, in such a case, it is possible to have the operations to be run up to the delivery. When the freshness specifications are more demanding, i.e., the use of the roasted beans should be limited to no more than 10 days since received, the order quantity (Q) will have to be reduced to no more than 413 lbs. This reduces wastage of an expaced product having adequate quantities to serve. Wild bypasses such situations by approach, by being parameter-alteration systematic.
Dog Coffee Company will be able to make good products, provide quality service, and be economically friendly in both conducive and adverse business as well as supply markets.
9. Implementation Roadmap
Week | Action |
1 | Configure inventory triggers |
2 | Recruit hires |
3–4 | Train staff, test dual-line peak service |
5 | Standardize weekly ordering |
6 | Review KPIs |
7 | Update forecast |
8 | Finalize playbook for second location. |
The implementation roadmap will provide a step-by-step eight weeks plan to implement the new demand management strategies appropriately. During week 1, one would be required to configure the inventory triggers within the point-of-sale system and automate the reorder notifications. The second week will be used to recruit the required part time workers in the staffing plan. Week 3-4 will involve wide staff training and pilot-testing the model of dual-line peak service in order to test the efficient operation of the model at the high-demand stages. The Continuous Review (Q, R) policy of standardized weekly ordering will be introduced in Week 5. In Week 6, the management will assess such key performance indicators (KPIs) as the time of service, the rates of stocks-out, and labor costs. The seventh week will assist in revising the challenging forecast on the current sales and advertising data. Finally, a playbook is developed during Week 8, and according to it, the localization of the company in the second place could be recreated.
References
Al-Suraihi, W. A., Samikon, S. A., Al-Suraihi, A.-H. A., & Ibrahim, I. (2021). Employee turnover: Causes, importance and retention strategies. European Journal of Business and Management Research, 6(3), 1–10. Researchgate. https://doi.org/10.24018/ejbmr.2021.6.3.893
Altemus, S. (2024, November 5). 6 negative effects of overtime on employee productivity. ActivTrak. https://www.activtrak.com/blog/effects-of-overtime-on-productivity/
Goodwin, P., Hoover, J., Makridakis, S., Petropoulos, F., & Tashman, L. (2023). Business forecasting methods: Impressive advances, lagging implementation. PLOS ONE, 18(12), e0295693–e0295693. https://doi.org/10.1371/journal.pone.0295693
Haddon, H., & Bousquette, I. (2025, April 29). Starbucks says new technology pilot is helping to fulfill coffee orders more quickly. WSJ; The Wall Street Journal. https://www.wsj.com/business/hospitality/starbucks-says-its-making-progress-on-quest-to-fulfill-orders-more-quickly-39492de6
Hondl, C. (2025, July 18). Safety stock: What it is, formula & examples. Finale Inventory. https://www.finaleinventory.com/inventory-planning-software/safety-stock
Kalcheva, N., Todorova, M., Marinova, G., & Feradov, F. (2025). Teaching linear regression with python and excel: Methods, tools, and practical tasks. Environment Technology Resources Proceedings of the International Scientific and Practical Conference, 3(1), 163–167. https://doi.org/10.17770/etr2025vol3.8556
Zhenjing, G., Chupradit, S., Ku, K. Y., Nassani, A. A., & Haffar, M. (2022). Impact of employees’ workplace environment on employees’ performance: A multi-mediation Model. Frontiers in Public Health, 10(1), 890400. NCBI. https://doi.org/10.3389/fpubh.2022.890400
Appendices:
Appendix A – Regression Analysis Table
Statistic | Value |
Intercept (β₀) | 188.22 |
Slope (β₁) | 0.7885 |
R² | 0.951 |
Month-7 forecast (x=$1,350) | 1,252.8 lbs |
95% CI (mean) | (1,198, 1,307) lbs |
95% PI | (1,112, 1,393) lbs |
Appendix B – Inventory Calculations
Metric | Value |
Avg daily beans | 41.3 lbs |
Avg daily drinks | 441 |
Safety stock (98% SL) | 10.0 lbs |
Reorder point R | 300 lbs |
Order qty Q (weekly) | 300 lbs |
Max order qty (14 days) | 575 lbs |
Appendix C – Staffing Scenarios
Scenario A
Role | Type | Base Hours | OT Hours | Weekly Cost ($) |
1 FT Barista | FT | 40 | 0 | 644 |
3 PT Baristas | PT | 20 | 4 | 1,092 total |
1 FT Non-barista | FT | 40 | 8 | 598 |
Role | Type | Base Hours | OT Hours | Weekly Cost ($) |
2 PT Non-baristas | PT | 20 | 6 | 414 total |
1 New PT Non-barista | PT | 20 | 6 | 207 |
Total | – | 200 | 38 | 3,215 |
Scenario B
Role | Type | Base Hours | OT Hours | Weekly Cost ($) |
1 FT Barista | FT | 40 | 0 | 644 |
3 PT Baristas | PT | 20 | 0 | 840 total |
1 New PT Barista | PT | 12 | 0 | 168 |
1 FT Non-barista | FT | 40 | 0 | 552 |
2 PT Non-baristas | PT | 20 | 0 | 360 total |
2 New PT Non-baristas | PT | 20 & 26 | 0 | 414 total |
Total | – | 238 | 0 | 3,137 |