

Assessment 1: Getting Started With Your Data
Overview: Throughout this course, you will be working toward your final assessment—an archival data research project. What does that mean? It means you will be using real data, collected as part of the General Social Survey (GSS), to answer a real question.
To help you complete this final assessment, these earlier assessments will walk you through the steps. In fact, to provide added assistance (and maybe even a sense of fun), you will have three fictional research assistants.
Meet your research assistants:
Juanita: She is junior in college with the intention of being a counselor. She’s more interested in the results of the study than in the process to get the results.
Duante: Duante is a senior in college who loves algebra but is skeptical about statistics. However, he wants a job where he can do research and is very interested in what you are doing.
Amanda: Amanda is a first-year student in college. She’s friendly and likes to talk a lot (and ask plenty of questions). She hasn’t been through her statistics course yet, but she is great at staying organized and loves using Excel.
Directions: Complete all six parts of this worksheet.
PART 1: GETTING STARTED
The General Social Survey (GSS) has been studying America, specifically American society, for 50 years. All of their data are available to the public (and to researchers). This makes GSS a great source for archival data projects. The surveys are long, providing a number of potential variables. For this project, certain variables have been chosen for you and the data extracted from the GSS site ahead of time. If you’re curious and want to learn more about GSS, feel free to check out the About the GSS web page.
Directions: Complete the steps below. These steps will prepare you for later portions of this assessment as well as for your final project.
Step 1: Choose your variables, one from each column and fill in the white blocks of the table below.
List A (Choose ONE variable from this list) | List B (Choose ONE variable from this list) |
RACLIVE. Have other race living in neighborhood. This is a Yes/No question asking respondents if they live in a neighborhood with people of another race. | HAPPY. General happiness. This asks the respondents to rate how happy they are (small Likert scale). |
NEWS. How often does respondent read newspaper. This question asks respondents to rate how often they read the newspaper (Likert scale). | LIFE. If life is exciting or dull. This question asks respondents to rate their life as exciting, routine, or dull (small Likert scale). |
WWWHR. Internet hours per week. This question asks respondents to share how many hours in a week they use the Internet for non-email activities. | MNTLHLTH. Days of poor mental health past 30 days. This question asks respondents how many days of poor mental health they’ve had in the past 30 days. |
DEPRESS. Told have depression. This is a Yes/No question asking respondents if they have been told they have depression. | |
My Variable (from List A): | My Variable (from List B): |
NEWS. How often does respondent read newspaper. This question asks respondents to rate how often they read the newspaper (Likert scale). | DEPRESS. Told have depression. This is a Yes/No question asking respondents if they have been told they have depression. |
Note: Once you’ve selected your variables, use them throughout the course. Changing variables partway through will require you to re-do work you’ve already done.
What’s your preliminary research question? Note: The survey method used to collect these data was not designed to allow you to determine causation or the effect of one variable on the other. |
Is there an association between how often a person reads the newspaper and whether they have been told they have depression? |
Step 2:Download data. Download the “GSS Data 2018” Excel file from the assessment. Make sure you save this somewhere on your computer (where you can find it again).
Step 3: Clean the data. In this case, Amanda helped you out and, if you look at the Excel file you downloaded, the data have been cleaned for you. She spent time going through the data to make sure there were results for both variables you will use and remove those participants who did not respond to both questions. She also made sure that the data were in a form that JASP could read accurately (right labels, right file format, et cetera). She’s a bit of an overachiever, so she cleaned everyone’s data. On the Excel spreadsheet, you will want to make sure you are on the right tab for your project. To understand what answer the numbers correspond to, look at the Codes tab.
Amanda’s Notes on Naming: · Raclive and happy: Projects looking at general happiness and whether people live in neighborhoods with people of another race. · Raclive and life: Projects looking at if life is exciting/dull and whether people live in neighborhoods with people of another race. · Raclive and mntlhlth: Projects looking at days of poor mental health and whether people live in neighborhoods with people of another race. · Raclive and depress: Projects looking at if someone has been told they have depression and whether people live in neighborhoods with people of another race. · News and happy: Projects looking at amount of time reading the news and general happiness. · News and life: Projects looking at amount of time reading the news and if life is exciting/dull. · News and mntlhlth: Projects looking at amount of time reading the news and days of poor mental health. · News and depress: Projects looking at amount of time reading the news and if someone has been told they have depression. · Wwwhr and happy: Projects looking at number of hours on the Internet and general happiness. · Wwwhr and life: Projects looking at number of hours on the Internet and if life is exciting/dull. · Wwwhr and mntlhlth: Projects looking at number of hours on the Internet and days of poor mental health. · Wwwhr and depress: Projects looking at number of hours on the Internet and if someone has been told they have depression. |
Step 4: Save your .csv file. Duante didn’t want to be outdone by Amanda, so he created .csv files of everyone’s data project. To find them, open the data files in the assessment and locate the data for your project. He used the same naming convention as Amanda did above. Make sure you save these files somewhere on your computer (where you can find them again).
PART 2: UNDERSTANDNG MEASURES OF CENTRAL TENDENCY
Amanda is confused by the measures of central tendency and has come to you asking questions.
Directions: Answer all questions in the table.
Scoring Criterion: Describe key statistical concepts.
What types of variables can you compute a useful mean for? Select as many options as apply. | ☐Nominal ☐Ordinal ☒Interval ☒Ratio |
When would a mean be useful? | The mean is most useful when the data is normally distributed and does not contain extreme outliers, as this ensures an accurate representation of central tendency. It is particularly effective when measuring the central tendency for continuous numerical data (Khorana et al., 2023). Examples include income, age, or temperature, where values are evenly spaced and meaningful calculations can be performed. |
Now what about the mode – what types of variables can you find a mode for? Select as many options as apply. | ☒Nominal ☒Ordinal ☒Interval ☒Ratio |
When is a mode useful? | A mode is useful when analyzing categorical data, such as identifying the most common response in a survey. It is also helpful when the distribution is multimodal, meaning it has multiple peaks, as well as when dealing with discrete variables rather than continuous ones. |
Then the median – what types of variables can you find the median for? Select as many options as apply. | ☐Nominal ☒Ordinal ☒Interval ☒Ratio |
And when would you use the median (and not the mean or mode)? | The median is useful when data is skewed or contains outliers. For example, median income provides a more accurate representation than the mean when extreme values are present. It is also appropriate when working with ordinal data, as it preserves the ranked order without assuming equal spacing between values (Khorana et al., 2023). |
What does the variance tell us? | Variance measures how spread out the data is from the mean, providing insight into the distribution of values within a dataset. A higher variance indicates greater dispersion among data points, while a lower variance suggests that the values are more closely clustered around the mean. |
Why is the variance important? | Variance is important because it helps in understanding data variability and consistency. It provides insight into how data points differ from the mean. It also serves as the foundation for standard deviation, which is easier to interpret in real-world contexts and is used in statistical testing, such as ANOVA and regression analysis. |
Consider the demographic data on our participants. Where might you use measures of central tendency? | Measures of central tendency can be used in several ways when analyzing the demographic data of participants. The mean could be useful for the age variable, as it provides an overall average age of respondents, assuming the data is normally distributed without extreme outliers. The median might also be helpful for age if the data is skewed. Since the NEWS variable is based on a Likert scale, the median would be the most appropriate measure of central tendency, as it preserves the ranked order without assuming equal spacing between responses. The mode could be useful for categorical variables like sex and race, as it helps identify the most common gender or racial group in the sample. Additionally, for the DEPRESS variable, which is a Yes/No question, the mode can determine whether more participants reported being told they have depression or not. |
PART 3: YOUR DATA
You’ve sent Amanda off to think more about measures and central tendency. Working with Duante, you start to consider your variables. He wants to know what the data type for each available variable is.
Directions: Fill in the table below.
Scoring Criterion: Determine data type.
What data type is our data (for JASP)? Note: JASP offers you three options: Nominal, Ordinal, Continuous. So, if the data is ratio or interval, call it continuous for the purpose of this table.
Variable | Type | Variable | Type | Variable | Type |
AGE | Continuous | RACE | Nominal | SEX | Nominal |
RACLIV | Nominal | NEWS | Ordinal | WWWHR | Continuous |
HAPPY | Ordinal | LIFE | Ordinal | MNTLHLTH | Continuous |
DEPRESS | Nominal |
NOTES:
Age: Respondents entered their exact age
Race: Respondents had a choice of: White, Black, or Other (The survey uses limited options, which is a limitation for modern studies but useful when comparing modern data with historical data.)
Sex: Respondents had a choice of: Male, Female (Based on biological sex at birth; this is not a variable looking at gender.)
Racliv: Respondents were given a Yes/No question on whether they lived in a neighborhood with other races.
News: Respondents were given a version of a Likert scale.
Wwwhr:Respondents entered the number of hours they are on the Internet each week.
Happy: Respondents were given a version of a Likert scale.
Life: Respondents were given a version of a Likert scale.
Mntlhlth: Respondents entered the numbers of days of poor mental health.
Depress: Respondents were given a Yes/No question on whether they had been told they had depression.
In JASP, select the three blue bars, then select open, then select the location you saved the .csvfile.
JASP tries to guess at it and will use the symbols below.

You and Duante look at JASP’s guesses.
- If JASP got it wrong, correct it.
- Click on the appropriate variable data icon in the column title to change it to the correct format.
JASP got the race classification wrong, categorizing it as ordinal. I have corrected it and changed it to nominal.

PART 4: DATA ON YOUR PARTICIPANTS
Continuing to work with Duante, you decide to learn more about your participants.
Duante has done some research into GSS and provides you with the following information:
The General Social Survey uses random sampling to get a representative sample of adults across the United States (NORC, 2019).
Reference:
National Opinion Research Center (NORC). (2019). Appendix A: Sampling design and weighting. In General Social Surveys 1972–2018: Cumulative Codebook (pp. 3171–3189). https://gss.norc.org/documents/codebook/GSS_Codebook_AppendixA.pdf
Before you start looking at your participants, Juanita has a few questions for you.
Directions: Answer the questions below.
Scoring Criterion: Explain the use of a mean with different types of variables.
Can you use a mean for the variable Sex? Why or why not? | The mean cannot be used for the variable Sex because it is a nominal variable with categorical values (Male, Female) that do not have numerical significance. Since the mean requires numerical data where arithmetic operations are meaningful, calculating an average for sex would not provide any useful interpretation. |
Can you use a mean for the variable Race? Why or why not? | The mean cannot be used for the variable Race because it is also a nominal variable with categorical values (White, Black, Other) that have no inherent numerical order or equal spacing. A mean is only appropriate for numerical variables, not for descriptive categories like race (Khorana et al., 2023). |
Can you use a mean for the variable Age? Why or why not? | The mean can be used for the variable Age because it is a continuous variable with meaningful numerical values. Since age is measured on a ratio scale with equal intervals and a true zero point, arithmetic calculations like the mean provide useful insights. Calculating the mean age of respondents can help summarize the overall age distribution within the dataset. |
Now that Juanita has a better understanding of the mean, the two of you start looking at your demographic data.
- Open JASP.
- Then open your .csv data file for your project. You can do this by clicking the three blue bars, selecting Open, then select Computer, then choose your file from wherever you saved it on your computer.
- In JASP, in your data file, select Descriptives.
- Select age, then select the
Copy and paste the resulting table below.
Descriptive Statistics
Descriptive Statistics | |||
age | |||
Valid | 938 | ||
Missing | 0 | ||
Mean | 44.843 | ||
Std. Deviation | 14.474 | ||
Minimum | 18.000 | ||
Maximum | 86.000 | ||
PART 5: GRAPHIC DISPLAY OF YOUR PARTICIPANTS
Juanita likes to process information visually and asks if you can create graphs or charts of the data.
Directions: Create a bar graph, pie chart, and frequency table by following the directions below.
Scoring Criterion: Communicate statistical data in graphs and tables.
In JASP, in your data file, select Descriptives.
- Select sex, then select the
- Select race then select the
- Click Basic Plots, then put a check next to Distribution plots.
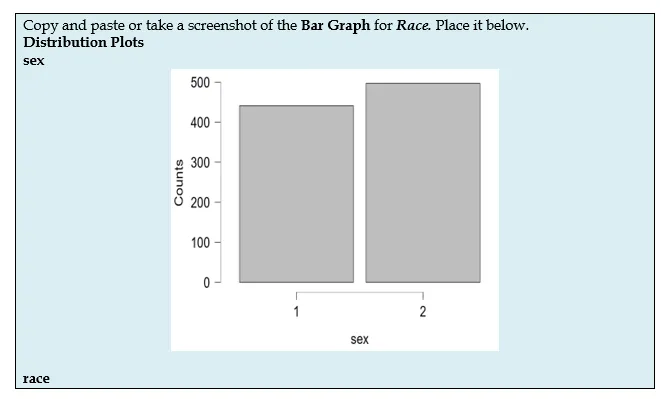
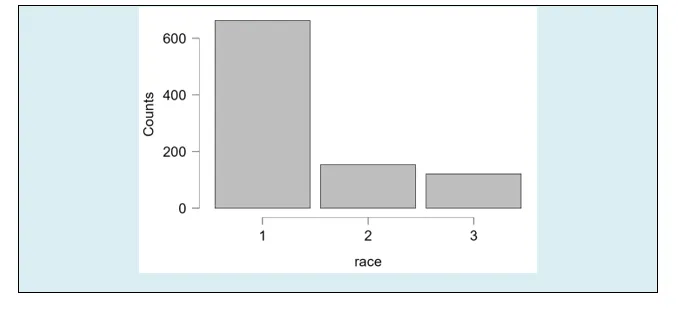
- Next, Click Basic Plots, then put a check next to Pie Charts.

- Lastly, click Tables, then put a check next to Frequency Tables.
Copy and paste or take a screenshot of the Frequency Chart for Race. Place it below.
Frequencies for race | |||||||||
race | Frequency | Percent | Valid Percent | Cumulative Percent | |||||
1 | 663 | 70.682 | 70.682 | 70.682 | |||||
2 | 154 | 16.418 | 16.418 | 87.100 | |||||
3 | 121 | 12.900 | 12.900 | 100.000 | |||||
Missing | 0 | 0.000 | |||||||
Total | 938 | 100.000 | |||||||
PART 6: LOOKING TO THE FUTURE
As you look over the participants, Amanda, Juanita, and Duante discuss what careers they want in the future. They ask you what your thoughts are and whether you’d ever consider a job that involves data analysis.
Directions: Answer all of the questions below.
Scoring Criterion: Discover career contingencies based on accurate self-assessment of abilities, achievement, motivation, and work habits.
Step 1: Statistics and data analysis are marketable job skills. Search the Internet for jobs you could apply for with a bachelor’s degree that require the use of statistics. Some good, key search terms: psychology research assistance or survey data analysis.
Step 2: Answer the following questions.
What is the job title? | Data Analyst – Neighborhood & Community Services |
Provide a link to the job ad. | https://echotalent.net/jobs/fa8e6f3293066924/data-analyst-neighborhood-community-services?utm_campaign=google_jobs_apply&utm_source=google_jobs_apply&utm_medium=organic |
What are the educational requirements? | A bachelor’s degree in analytics, informatics, mathematics, survey design, statistics, data science, computer science, healthcare administration, or a related field. Additionally, a minimum of two years of professional experience in data research, quantitative analysis, statistics, data science, or data analytics is required. |
What other job requirements stand out to you? | There are several stand-out job requirements for this role. Proficiency in working with large, complex relational databases and applying statistical techniques for data analysis and program evaluation is a prerequisite to the position. However, the candidate should also be aware of several statistical and business intelligence tools such as SPSS, SQL, and PowerBI. Another key requirement is to be able to build data visualizations, reports, and business intelligence dashboards while collaborating with leadership, staff, and partner agencies. In addition to the skills mentioned above, the position calls for strong data management skills and the ability to ensure data accuracy as well as to convey analytical insights to different stakeholders. |
Does the job sound interesting to you? Why or why not? | It seems to be a highly engaging position for those who are driven by data analysis and community services. The role offers the opportunity to interact with diverse datasets, create impactful visualizations, and help community programs by collaborating with multiple stakeholders. It is a compelling opportunity for those who wish to make a difference with their data-driven decision-making through their technical data skills and focus on community improvement. |
References
Khorana, A., Pareek, A., Ollivier, M., Madjarova, S. J., Kunze, K. N., Nwachukwu, B. U., Karlsson, J., Marigi, E. M., & Williams, R. J. (2023). Choosing the appropriate measure of central tendency: Mean, median, or mode? Knee Surgery, Sports Traumatology, Arthroscopy: Official Journal of the ESSKA, 31(1), 12–15. https://doi.org/10.1007/s00167-022-07204-y